Marketing / Budget / Strategy / Small Business
How Much Should a Small Business Spend on Marketing in 2027?
A practical guide to setting next year's marketing budget: the benchmarks, the share of revenue that fits your stage, how to work back from your sales goal, where the money should go first, and a one-page template to fill in.
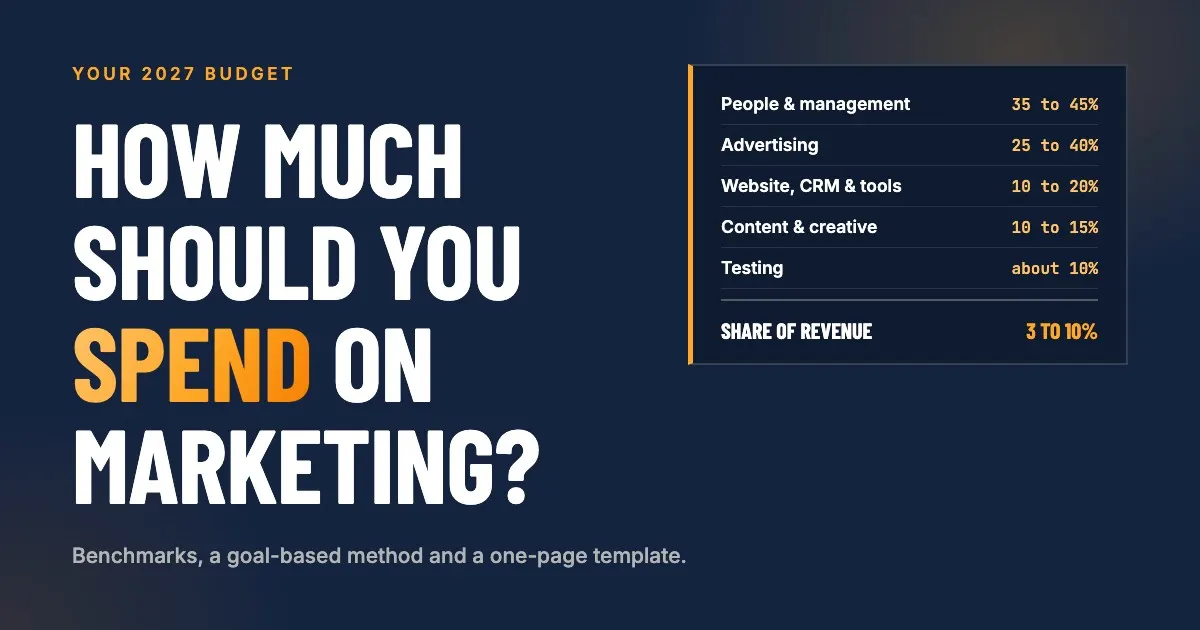
The short answer: most small businesses spend somewhere between 3 and 10 percent of yearly revenue on marketing. Stay near the low end if you are established, busy and well referred; plan for the high end, or more for a while, if you want to grow quickly, have just launched or are entering a new market. At $1 million in revenue, that is $30,000 to $100,000 a year, or $2,500 to $8,300 a month. But a percentage is only a starting point. The number that holds up is the one you work back from your sales goal: how many new customers you need, how many leads that takes, and what a lead costs in your market. This guide walks you through both, shows where the money should go first, and ends with a one-page budget you can fill in.
Budget season is when most owners ask this question, and when they most often get one of two answers. “Spend 7 to 8 percent” sounds precise but says nothing about your business. “It depends” is true and not useful at all.
The real answer sits between them. A dental practice with a waiting list, a home services company that wants a second crew and a consulting firm launching a new offer should not spend the same share of revenue, even at the same size. What they can all do is use the same method: check a benchmark, set a goal, do the math in dollars, and fund the parts of marketing that bring in customers before the parts that look busy.
The first sections answer the questions most owners ask first: what the benchmarks say and what share fits your stage. Further down is the goal-based method with a worked example, how to split the budget, what to fund first at different budget sizes, and the mistakes that waste the most money.
What do the benchmarks say?
There is no official number, and the most quoted figures come from very different businesses. Here is what the main sources say, and how to read them:
| Source | What it found | How to read it |
|---|---|---|
| Gartner 2026 CMO Spend Survey | Marketing budgets averaged 7.8 percent of company revenue in 2026, up from 7.7 percent in 2025 | Large companies with established brands and marketing teams |
| Figures cited by the U.S. Small Business Administration | Average marketing spend of 7.9 percent of revenue (2018); B2B product companies 6.3 percent, B2B services 6.9 percent, B2C product 9.6 percent, B2C services 11.8 percent | Older, but it shows the spread by business model |
| Figures cited by the U.S. Small Business Administration | The average business spends about 1.08 percent of revenue on advertising alone; retailers about 4 percent, restaurants 1.93 percent | Advertising only, not people, tools or the website |
| Common small business rule of thumb | 7 to 8 percent of revenue | A reasonable middle, not a rule |
Three patterns come through, and they matter more than any single figure:
- Consumer businesses spend more than business-to-business ones. Selling to many individuals usually takes more reach than selling to a few companies.
- Services sit at both ends. Consumer services, such as clinics, salons and home services, often spend the most; business services spend less on ads and more on relationships, content and people.
- Advertising is a fraction of the total. When people say “marketing budget” they often mean ads. The full budget also covers who does the work, the tools and the website, and those can be the larger share.
The SBA’s own advice is the most useful part: there is no hard and fast answer, many businesses use a percentage of revenue as a guide, startups should use projected revenue, and your industry’s trade association often has benchmarks closer to your situation.
What share of revenue fits your stage?
A percentage makes sense only next to what you want marketing to do. These ranges are practical starting points for small businesses, based on the benchmarks above and on what we see in owner-led businesses:
| Your situation | Typical share of revenue | What the money mostly does |
|---|---|---|
| Maintain: established, steady referrals, close to capacity | About 2 to 5 percent | Keeps the website, reviews, search presence and follow-up working; stays in touch with past customers |
| Grow: you want 15 to 30 percent more revenue | About 5 to 10 percent | Adds lead generation, usually search and ads, plus the people and systems to follow up and measure |
| Launch or expand: new business, new market, new location or new offer | About 10 to 20 percent, for a defined period | Builds the foundation and buys attention before referrals and rankings exist |
Two things move you up or down within a range:
- Your margins. A business with 60 percent gross margins can afford to pay more for a customer than one with 20 percent. Spend what your margins can carry, not what a benchmark says.
- What a customer is worth over time. If a customer buys once for $300, you cannot pay $250 to win them. If they stay five years, you can pay much more than their first invoice.
To see what the ranges mean in dollars, here are yearly budgets at common revenue levels. Divide by 12 for the monthly figure.
| Yearly revenue | 3 percent | 5 percent | 8 percent | 12 percent |
|---|---|---|---|---|
| $250,000 | $7,500 | $12,500 | $20,000 | $30,000 |
| $500,000 | $15,000 | $25,000 | $40,000 | $60,000 |
| $1,000,000 | $30,000 | $50,000 | $80,000 | $120,000 |
| $2,000,000 | $60,000 | $100,000 | $160,000 | $240,000 |
| $3,000,000 | $90,000 | $150,000 | $240,000 | $360,000 |
Why is a percentage only the starting point?
A share of revenue tells you what similar businesses spend. It does not tell you what your goal costs. It also works backwards in an awkward way: when revenue drops, a fixed percentage cuts marketing exactly when you need more customers, and when revenue rises, it hands marketing more money whether or not anything works.
Use the percentage as a sanity check. Set the actual number from the goal, then compare: if your goal-based budget comes out at 25 percent of revenue, either the goal is too ambitious for one year or something in the funnel, such as the close rate or the price, needs fixing first. If it comes out at 1 percent, the goal may be too timid, or you are leaving growth on the table.
How do you set a budget from your sales goal?
This is the method that holds up in front of a banker, a business partner or yourself in March. It takes six numbers, most of which you can estimate from last year.
- Revenue goal: how much more revenue you want from new customers next year.
- Value of a new customer: the average revenue from a new customer in the first year. Use the first year, not the lifetime, so the budget pays back within the year.
- New customers needed: the revenue goal divided by the value of a new customer.
- Close rate: of the leads you talk to, how many become customers. If you do not know, look at last month’s enquiries and count.
- Leads needed: new customers needed divided by the close rate.
- Cost per lead: what a lead costs in the channels you will use. Your own history is best; industry benchmarks are the fallback.
Then add the fixed costs that do not scale with leads: the website, CRM and tools, and the people who run the marketing.
A worked example
A home services company with $1,000,000 in revenue wants to grow to $1,200,000 next year.
| Step | Number |
|---|---|
| Revenue goal from new customers | $200,000 |
| Average first-year value of a new customer | $2,500 |
| New customers needed | 80 |
| Close rate | 25 percent |
| Leads needed | 320 |
| Leads expected from referrals, reviews and search without paying per lead | 160 |
| Leads to buy through ads | 160 |
| Cost per lead (cross-industry average for search ads) | about $67 |
| Ad spend | about $10,700 |
Now the fixed costs:
| Fixed cost | Per year |
|---|---|
| CRM with follow-up automations, such as HighLevel, including usage | about $1,500 to $4,000 |
| Website improvements and upkeep | about $3,000 to $6,000 |
| Someone to run it: a fractional marketing manager at around $2,000 a month | about $24,000 |
| Content, photos and video | about $3,000 |
| Fixed total | about $31,500 to $37,000 |
Together that is roughly $42,000 to $48,000, or about 4 to 5 percent of current revenue, to win $200,000 in new revenue. If the company’s gross margin is 40 percent, the new revenue brings about $80,000 in gross profit in the first year alone, before repeat work and referrals from the new customers. The budget passes the sanity check.
The example also shows where to look if the number comes out too high. Raising the close rate from 25 to 33 percent cuts the leads needed from 320 to about 240. Following up every lead within minutes, which a CRM can do automatically, is often the cheapest way to get there. Fixing the funnel is usually cheaper than buying more leads.
Where to find your own numbers
- Revenue and customer value: your accounting software. Divide last year’s revenue from new customers by the number of new customers.
- Close rate: your CRM, or a count of last quarter’s enquiries against the jobs or contracts that followed.
- Cost per lead: your ad accounts, if you have run ads; otherwise industry benchmarks. Across industries, search ads averaged $5.42 per click and $66.69 per lead in WordStream by LocaliQ’s 2026 benchmarks, with automotive repair and restaurants at about $30 per lead and legal services the highest at $131.63.
- Lead sources: if you cannot say where last year’s leads came from, that is the first thing to fix. Our guide to UTM parameters in HighLevel shows how to track every lead to its source.
What counts as marketing spend?
Count everything you spend to win and keep customers. A budget that only lists ads hides most of the cost and makes every lead look cheaper than it is.
| Include | Examples |
|---|---|
| People | Staff time spent on marketing, freelancers, an agency, a fractional marketing manager |
| Advertising | Google and Microsoft ads, Meta ads, local directories, sponsorships, print |
| Website | Build or rebuild, hosting, upkeep, improvements |
| Tools | CRM, email and texting, scheduling, design and analytics tools |
| Content and creative | Photos, video, writing, design |
| Events and relationships | Trade shows, local events, networking memberships, client gifts |
Your own time counts too, even if it never shows up on an invoice. If you spend ten hours a week on marketing and your hour is worth $100 in sales or delivered work, that is about $50,000 a year of your time. It is often the most expensive line in a small business budget, and the one most worth replacing.
How should you split the budget?
There is no perfect split, because it depends on what you already have. A business with a strong website and CRM spends less on the foundation; a business starting from scratch spends more on it in the first year. As a starting point for a growth budget:
| Area | Share of the marketing budget | What it covers |
|---|---|---|
| People and management | 35 to 45 percent | Whoever plans, does and measures the work |
| Advertising | 25 to 40 percent | Search, social and other paid placements |
| Website, CRM and tools | 10 to 20 percent | The foundation that turns attention into enquiries and follow-up |
| Content and creative | 10 to 15 percent | Photos, video, writing, design |
| Testing | About 10 percent | New channels or offers, with a clear test and a stop date |
Two notes on the split:
- People are not overhead. Ads without someone to set them up, watch them and follow up the leads are the most common way small businesses waste money. A smaller ad budget with good management usually beats a bigger one without.
- Keep a test budget, and protect it. About a tenth of the budget for trying something new, with a written goal and an end date, keeps you from betting the year on one channel.
What should you fund first?
When the budget is limited, the order often matters more than the amount. The order below is a good starting point for most small businesses, not a fixed rule. Adjust it to your situation and goals: a business that lives on referrals may put email to past customers ahead of ads, a new business may need ads from day one to get its first customers, and a business with a strong website can skip straight to what is missing. In general, the steps near the top make every dollar further down work harder, so it pays to have the basics in place before you spend heavily on the rest.
- The foundation. A website that loads fast, works on a phone and makes it obvious how to get in touch; a CRM that captures every enquiry; tracking that shows where leads come from. Without this, every dollar spent further down leaks. If you are weighing a rebuild, our comparison of WordPress and a full AI website covers the options.
- Follow-up. Answer every lead within minutes, follow up those who do not answer, and remind people of booked appointments. This costs little and often lifts the close rate more than anything else on this list.
- Your Google Business Profile and reviews. Complete the profile, post updates and ask every happy customer for a review. For local businesses this is the best return in marketing.
- Search, where people are already looking. Search engine optimization for the services you sell, and search ads on the highest-intent searches, the ones that include your service and your town. Our complete guide to SEO, AEO and GEO explains how to be found on Google and in AI answers.
- Email to past customers and leads. The people who already know you are the cheapest to win again. A short, useful email once or twice a month keeps you in mind.
- Social media and brand. Valuable, but slower to turn into revenue. Do it consistently, not expensively, until the steps above work.
- Bigger campaigns and new channels. Video, wider ad audiences, events, partnerships. Fund them from the test budget first.
What does the budget look like at different sizes?
Here is how the same order plays out at three common budget sizes. These are examples, not prescriptions.
About $1,000 a month
- CRM with follow-up automations: about $100 to $300 a month, including usage. Our guide to what HighLevel really costs breaks down every fee.
- Search ads on your highest-intent searches: about $500 to $800 a month, in a tight area.
- Google Business Profile, reviews and a monthly email: your time, or a few hours of a freelancer.
- The owner still leads the marketing. Keep it simple and measure every lead.
About $3,000 to $5,000 a month
- Someone to run it, such as a fractional marketing manager: about $2,000 to $3,000 a month.
- Advertising: about $1,000 to $2,000 a month, on search first.
- CRM, tools and website upkeep: about $200 to $500 a month.
- Content: a small monthly amount for photos, short videos or articles.
- The owner reviews a monthly report and makes decisions, instead of doing the work.
About $8,000 to $15,000 a month
- Management plus specialist help where needed: about $3,000 to $6,000 a month.
- Advertising across two or three channels: about $3,000 to $6,000 a month.
- Content and creative on a regular schedule: about $1,000 to $2,000 a month.
- Tools, website and testing: the rest.
- At this level, compare the full cost against a fractional marketing manager versus a full-time hire. The U.S. Bureau of Labor Statistics put the median annual wage for marketing managers at $166,790 and for marketing specialists at $78,760 in May 2025, before benefits.
How do you plan the budget across the year?
A yearly number is easier to approve than to spend well. Break it down:
- By month, following your season. Spend more in the weeks before your busy season, when people are deciding, and less when you are fully booked. A heating company and a tax preparer should not have flat monthly budgets.
- By quarter, with a review. At the end of each quarter, look at what each channel returned and move money to what worked. A budget that never changes during the year is a guess that never gets corrected.
- Fixed costs first, variable costs second. Commit the foundation, tools and management for the year; keep advertising and tests flexible month to month.
- A reserve for opportunities. A small share left unassigned lets you act on a good idea in June without cutting something that works.
How do you know the budget is working?
Measure in dollars and customers, not in likes or impressions. Check these every month:
- Leads by source: where each enquiry came from.
- Cost per lead: by channel, including the cost of managing it.
- Close rate: how many leads become customers.
- Cost per new customer: total marketing spend divided by new customers.
- Revenue from new customers: what they brought in.
- Payback: how many months a new customer takes to cover what it cost to win them.
The rule is simple. If a channel brings customers at a cost your margins can carry, give it more. If it does not after a fair test, usually three months for ads and longer for search engine optimization, move the money.
When should you spend more, and when less?
Spend more when:
- A channel brings customers profitably and has room to grow.
- You are launching, opening a new location or entering a new market.
- Sales are slowing. The SBA advises considering more marketing, not less, in a slowdown, because cutting it also cuts the pipeline for the months ahead.
- You have capacity: open slots, idle crews or stock to move.
Spend less, or hold, when:
- You are fully booked and cannot deliver more. Spend on keeping customers and raising prices instead.
- Leads come in but are not followed up. Fix the follow-up before buying more leads.
- You cannot measure where customers come from. Fix the tracking first.
What are the most common budget mistakes?
- Counting only ads. The budget looks small, every lead looks cheap, and nobody plans for the people and tools that make the ads work.
- Spreading thin. A little on every platform rarely does as well as enough on the two that fit your customers.
- Buying leads into a leaky funnel. Slow replies, no follow-up and a confusing website waste more money than any bad ad.
- Setting the budget once a year and never looking again. Review quarterly and move money to what works.
- Cutting marketing first when sales slow. It saves money this month and costs customers next quarter.
- No tracking. Without knowing where customers come from, every budget decision is a guess.
- Ignoring your own time. The hours you spend on marketing are real money, and usually better spent on the work only you can do.
A one-page budget you can fill in
Download the marketing budget template (Excel, also opens in Google Sheets and Apple Numbers). It has the formulas built in: fill in the yellow cells and the rest works itself out. A second tab holds the worked example from this guide, so you can see how it fits together before you enter your own numbers.
If you prefer to build it yourself, here is every line, how to work it out and the example numbers: the worked example above, with the middle of each cost range and 10 percent added for testing. The lines in bold with a calculation are the ones a spreadsheet does for you.
| # | Line | How to work it out | Example |
|---|---|---|---|
| 1 | Current yearly revenue | From your accounting software | $1,000,000 |
| 2 | Revenue goal for next year | Where you want to be in 12 months | $1,200,000 |
| 3 | Extra revenue needed from new customers | Line 2 minus line 1 | $200,000 |
| 4 | First-year value of a new customer | Last year’s revenue from new customers ÷ number of new customers | $2,500 |
| 5 | New customers needed | Line 3 ÷ line 4 | 80 |
| 6 | Close rate | Share of leads that become customers | 25% |
| 7 | Leads needed | Line 5 ÷ line 6 | 320 |
| 8 | Leads expected without paying per lead | Referrals, reviews, search and repeat enquiries, from last year | 160 |
| 9 | Leads to buy | Line 7 minus line 8 | 160 |
| 10 | Cost per lead | Your ad accounts, or industry benchmarks | $67 |
| 11 | Ad spend | Line 9 × line 10 | $10,720 |
| 12 | People: staff time, freelancers, agency or fractional | For the year | $24,000 |
| 13 | Website: build, upkeep and improvements | For the year | $4,500 |
| 14 | CRM and tools | For the year, including usage | $2,500 |
| 15 | Content and creative | For the year | $3,000 |
| 16 | Subtotal | Lines 11 to 15 added up | $44,720 |
| 17 | Testing | About 10 percent of line 16 | $4,472 |
| 18 | Total marketing budget | Line 16 plus line 17 | $49,192 |
| 19 | Per month | Line 18 ÷ 12 | $4,099 |
| 20 | Share of current revenue | Line 18 ÷ line 1 | 4.9% |
| 21 | Gross margin | Revenue minus the direct cost of delivering it, as a share of revenue | 40% |
| 22 | Expected gross profit from new customers | Line 3 × line 21 | $80,000 |
| 23 | Cost per new customer | Line 18 ÷ line 5 | $615 |
How to read the result:
- Line 20 should land in or near the range for your stage. If it is far above, the goal may be too ambitious for one year, or the close rate or customer value needs work first. If it is far below, the goal may be too timid.
- Line 22 should be well above line 18. If it is not, the new customers do not pay for the marketing in the first year, and you need either repeat business to make up the difference or a different plan.
- Line 23 should be well below line 4. That is what it costs to win a customer, next to what that customer brings in during the first year.
It takes about an hour, and you end up with a budget you can explain to anyone. Your first version will rest on estimates; replace them with real numbers as the months go by, and the budget gets more accurate every quarter.
How Ímpetu helps you set and run the budget
Ímpetu Consulting works with small, owner-led businesses as a hands-on fractional marketing manager. Setting the budget is one of the first things we do together: we work back from your sales goal, check it against your margins, decide what to fund first, and write it down in dollars before anything is spent.
Then we run it: the website, the CRM and follow-up, search and ads, content and reporting. Every month you see what came in, what it cost and what changes next, so the budget gets better as the year goes on. You can see the marketing work we take on, or book a call to set next year’s number together. If your budget is better spent elsewhere, we will say so.
Sources
- Gartner: 2026 CMO Spend Survey (marketing budgets at 7.8 percent of company revenue in 2026, 7.7 percent in 2025)
- U.S. Small Business Administration: How to get the most from your marketing budget (no fixed answer, percentage of revenue as a guide, projected revenue for startups, spending by business model, advertising share, and more marketing in a slowdown)
- Search Engine Journal: What are good Google Ads benchmarks in 2026? (WordStream by LocaliQ search advertising benchmarks, April 2025 to March 2026: average cost per click, cost per lead and industry figures)
- U.S. Bureau of Labor Statistics: Advertising, promotions, and marketing managers (median annual wage for marketing managers, May 2025)
- U.S. Bureau of Labor Statistics: Market research analysts (median annual wage for market research analysts and marketing specialists, May 2025)
FAQ
Frequently asked questions
How much should a small business spend on marketing?
Most small businesses land somewhere between 3 and 10 percent of yearly revenue. An established business with steady referrals can stay near the low end; a business that wants to grow quickly, enters a new market or has just launched usually needs the high end or more for a while. The better answer comes from working back from your sales goal: how many new customers you need, how many leads that takes and what a lead costs in your market.
What percentage of revenue should go to marketing?
As a starting point, about 2 to 5 percent to maintain an established business, 5 to 10 percent to grow, and 10 to 20 percent for a defined period when launching, entering a new market or opening a new location. Large companies averaged 7.8 percent of revenue in Gartner's 2026 CMO Spend Survey. Use the percentage to check your number, not to set it.
How do I calculate a marketing budget?
Start with the extra revenue you want, divide by what an average new customer is worth to find how many new customers you need, divide by your close rate to find how many leads that takes, and multiply by your cost per lead. Add the fixed costs: website, CRM and tools, and the people who run the marketing. Then check the total against your margins and against a percentage of revenue.
Should a new business spend more on marketing?
Usually yes, as a share of revenue. A new business has no referrals, reviews or search rankings yet, so it has to buy attention and build the foundation at the same time. The U.S. Small Business Administration suggests startups use projected revenue as the basis for the percentage, and plan to spend more while they build awareness.
What should a small marketing budget be spent on first?
On the foundation and on the demand that already exists: a website that turns visitors into enquiries, a complete Google Business Profile, a CRM that follows up every lead quickly, and tracking that shows where leads come from. Then on reviews and on search, where people are already looking for what you sell. Social media, brand campaigns and larger tests come after that works.
Does the marketing budget include salaries and software?
It should. Count everything you spend to win and keep customers: the people who do or manage the work (staff, freelancers, an agency or a fractional marketing manager), advertising, software such as your CRM and email tools, the website, content and production, and events or sponsorships. Leaving people and tools out makes the budget look smaller than it is and hides what each lead really costs.
How much does Google Ads cost for a small business?
It depends on your industry and location. Across industries, Google and Microsoft search ads averaged $5.42 per click and $66.69 per lead between April 2025 and March 2026, according to WordStream by LocaliQ, with legal services the most expensive at $131.63 per lead. A small local business can start with a few hundred to a few thousand dollars a month on its highest-intent searches.
Should I cut marketing when sales slow down?
Not by reflex. The U.S. Small Business Administration advises considering more marketing, not less, when sales slow, because cutting it also cuts the pipeline for the months ahead. Cut what does not bring in customers, keep or move money to what does, and protect follow-up with existing customers and leads, which is usually the cheapest revenue you have.
How do I know if my marketing budget is working?
Track a few numbers every month: leads by source, cost per lead, close rate, cost per new customer and revenue from new customers. Compare cost per customer with what a customer is worth over time. If a channel brings customers at a cost your margins can carry, give it more; if it does not after a fair test, move the money.

Written by
Konstantin von BrockeFounder of Ímpetu Consulting. Konstantin is a fractional marketing manager for small businesses and nonprofits: he leads the plan, the work and the people, and builds the tracking that shows what pays off.